Many of us use our vehicles to drive to-and-from work, plus the additional grocery shopping trip every now and then. But how much time do you actually spend driving? Does that vary a lot from month to month? And what’s your average monthly mileage?

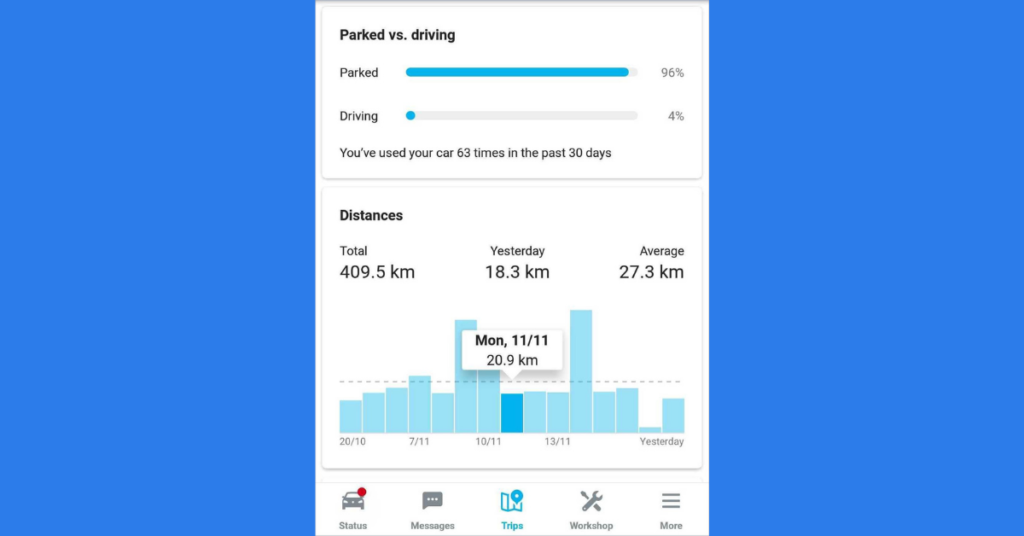
Get a full overview of driving time, distance, and trips for a selected period of time. The summary section at the top also includes your usage trends compared to the previous month, so you can see whether there have been any significant changes to your driving time or distance.

You can also see a percentage of how much you’re driving your car versus how long it’s parked.
This may come as a surprise, but the below percentages actually apply to the majority of drivers using a car primarily for commuting to work and other small chores.
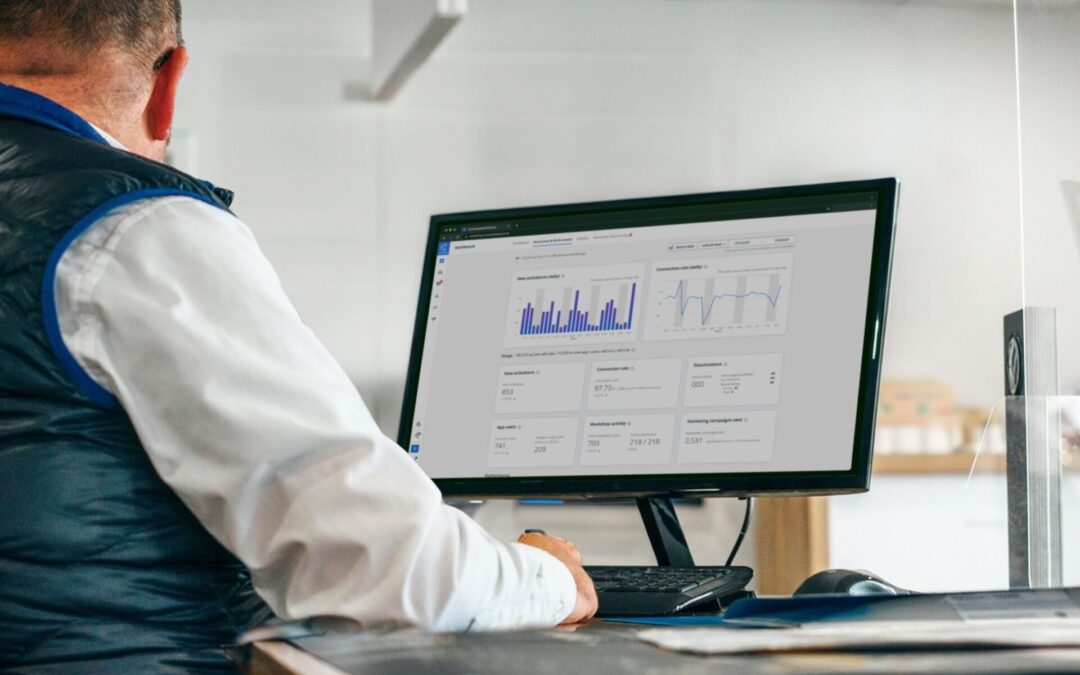
What’s new
Our latest release — statistics — is a feature that provides app users with even more insights into their cars and usage.
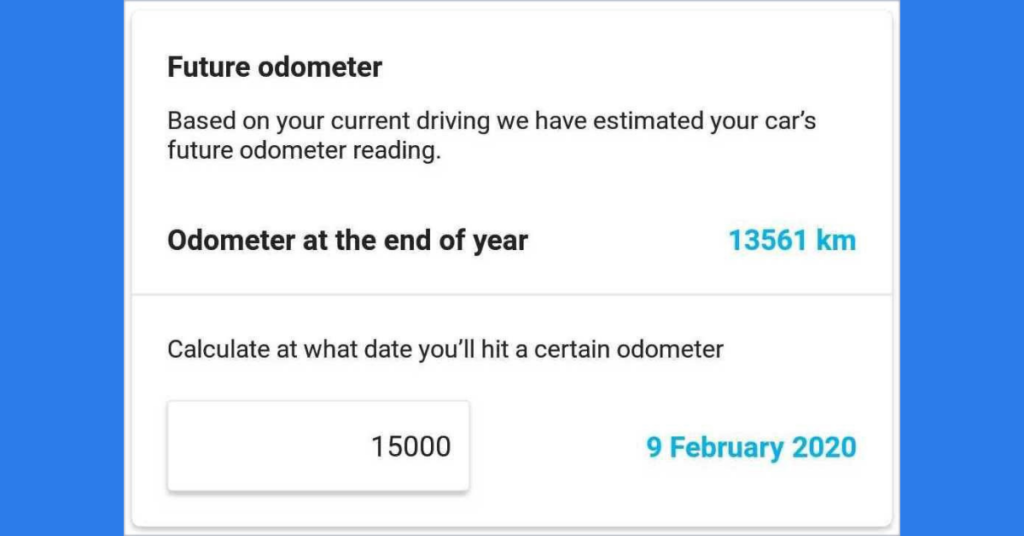
The statistics include an odometer section where you can check out what your odometer will look like at the end of the year or use our calculator to know when you’ll reach a specific odometer.
Better visualization of your car usage
The statistics provide you with insights into your car usage, so you can better understand when, how far, and how often you drive your car.