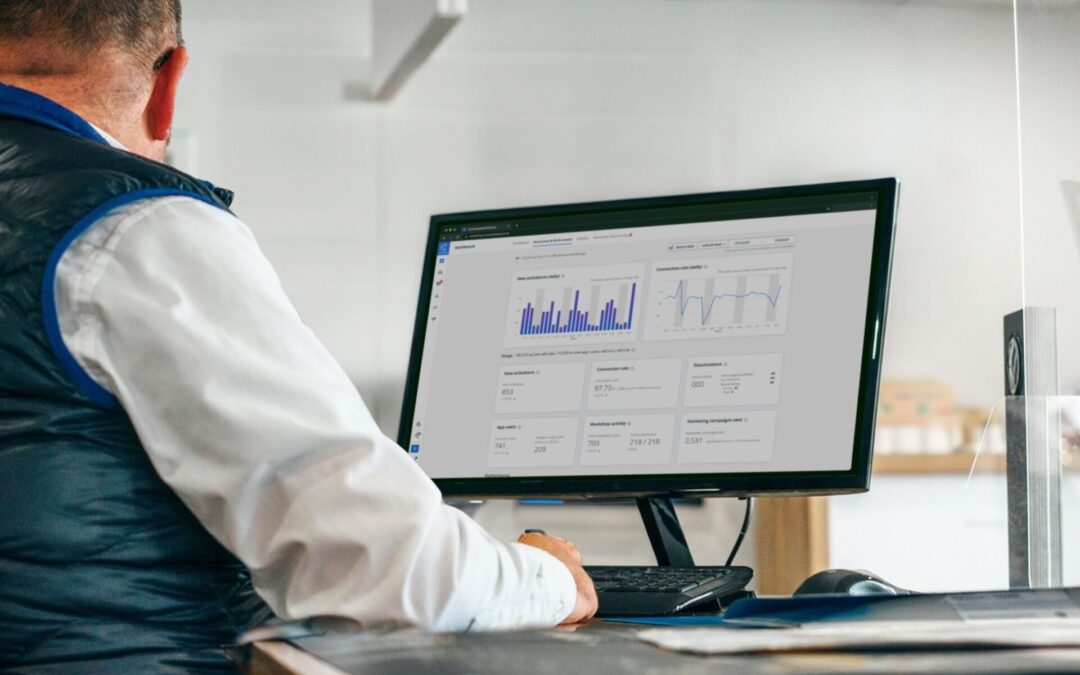
The performance dashboard is here! We are proud to announce the launch of our metrics Dashboard: tailor-made for importers as well as workshop managers and owners.
After many years of developing a product, creating a connectivity suite, and deploying it in different markets, we might have an insight or two on what it takes to succeed with connectivity—short answer: Many things. But one of the most crucial is keeping an eye on the ball. Especially if you’re a manager, regardless of the level. To disrupt an industry like the automotive one with so many key stakeholders, a crazy number of dealerships, and opportunities from left to right, it is crucial not to lose sight of what you set out to achieve. That means helping dealerships be proactive with customers digitally and efficiently. All thanks to car data.
We get it; it’s a new product that comes with new processes and new insights. It can be overwhelming sometimes. Therefore in this first iteration of our new Dashboard, we have tried to give the answers to the three most common doubts we get from stakeholders:
- Does the product I bought work well?
- Is the product I bought being used?
- Is the product I bought bringing the value I expected? Or more.
Why do ConnectedWorkshop owners and importers need metrics to overview their connectivity efforts?
The automotive industry is not a slow-paced one. Anybody who has been in a dealership in the past year knows that time matters. People are busy and interact with many people and projects simultaneously. Therefore, if you are going to establish new tools and processes in the day-to-day workload, they should improve processes.
That’s why these metrics are important. They are the ones that enable workshops to:
1. Focus: Things are going in the right direction
2. Clarity and efficiency: Why do workshops do what they do?
It is very difficult to know this if you can’t evaluate how a dealership is performing according to its possibilities. The same goes for targets; it’s difficult to know if you’re hitting them if you can’t monitor them daily. This is addressed in the new Dashboard view.

Performance Dashboard – It’s all in the implementation
A Dashboard isn’t a new concept by any stretch. We’ve all interacted with many such and know that numbers only matter if they are actionable. That’s why we’ve focused on adding these metrics—we know from experience and feedback— those help dealers. These metrics help key stakeholders study the value of their business and reach a decision for new processes and long-term decisions. And more importantly, workshop owners and managers can handle their business in the most efficient way possible. The new Dashboard has a unique variety of implementation optimizations of connectivity processes in all our current and future markets.
It’s essential to be transparent about the quality of the data and systems

Not everyone is a data engineer, much less in the auto industry. That is why our data quality is very transparent together with the product suite, and hardware quality. Many things happen, and it’s very easy for a user to generalize issues to an overall solution. That’s why we introduce stability metrics, the possibility of stakeholders to see the status of metrics like API uptime, Crashfree App users, and data points coming from the device, etc. Transparency is vital in the data business. The moment a customer stops trusting the numbers, will likely not trust the service either. Therefore, after so much hard work and incredible team effort, we just decided to open the numbers to our customers so they always have them readily accessible to avoid any unnecessary doubt.
Why does connection rate matter and how does the performance dashboard help?

This is the prized possession of our new dashboard. Why? Activation numbers are mute if you don’t know your potential. Therefore we introduce “connection rate.” Simply the number of connected vehicles you have compared to your potential. When we started to look at things this way, we could spot the differences between dealers that have 90% of the customers connected vs. dealers that were at 30%. When you have many dealerships varying in sizes, you need to see the percentage and not in counts of vehicles to understand the performance and opportunities in each retailer.
You can set goals and study trends. It’s a simplified and elegant way of talking about your connectivity efforts.
Showcasing value through saved phone calls
With the performance dashboard simplicity always wins. It’s easy to go down the rabbit hole of the possibilities that car data brings, but one of the biggest showstoppers is just how many phone calls are being saved by the simplest of metrics: Chat Conversations. When dealers see the number of messages that went in and out with customers through the chat (thus avoiding phone calls), it’s difficult to hide the smile. People tend not to factor in these things when analyzing the value of these systems in the dealerships. Still, we are confident that more value will be given to connectivity systems and data in general by displaying these metrics.